tut:pd
Phase diagram construction
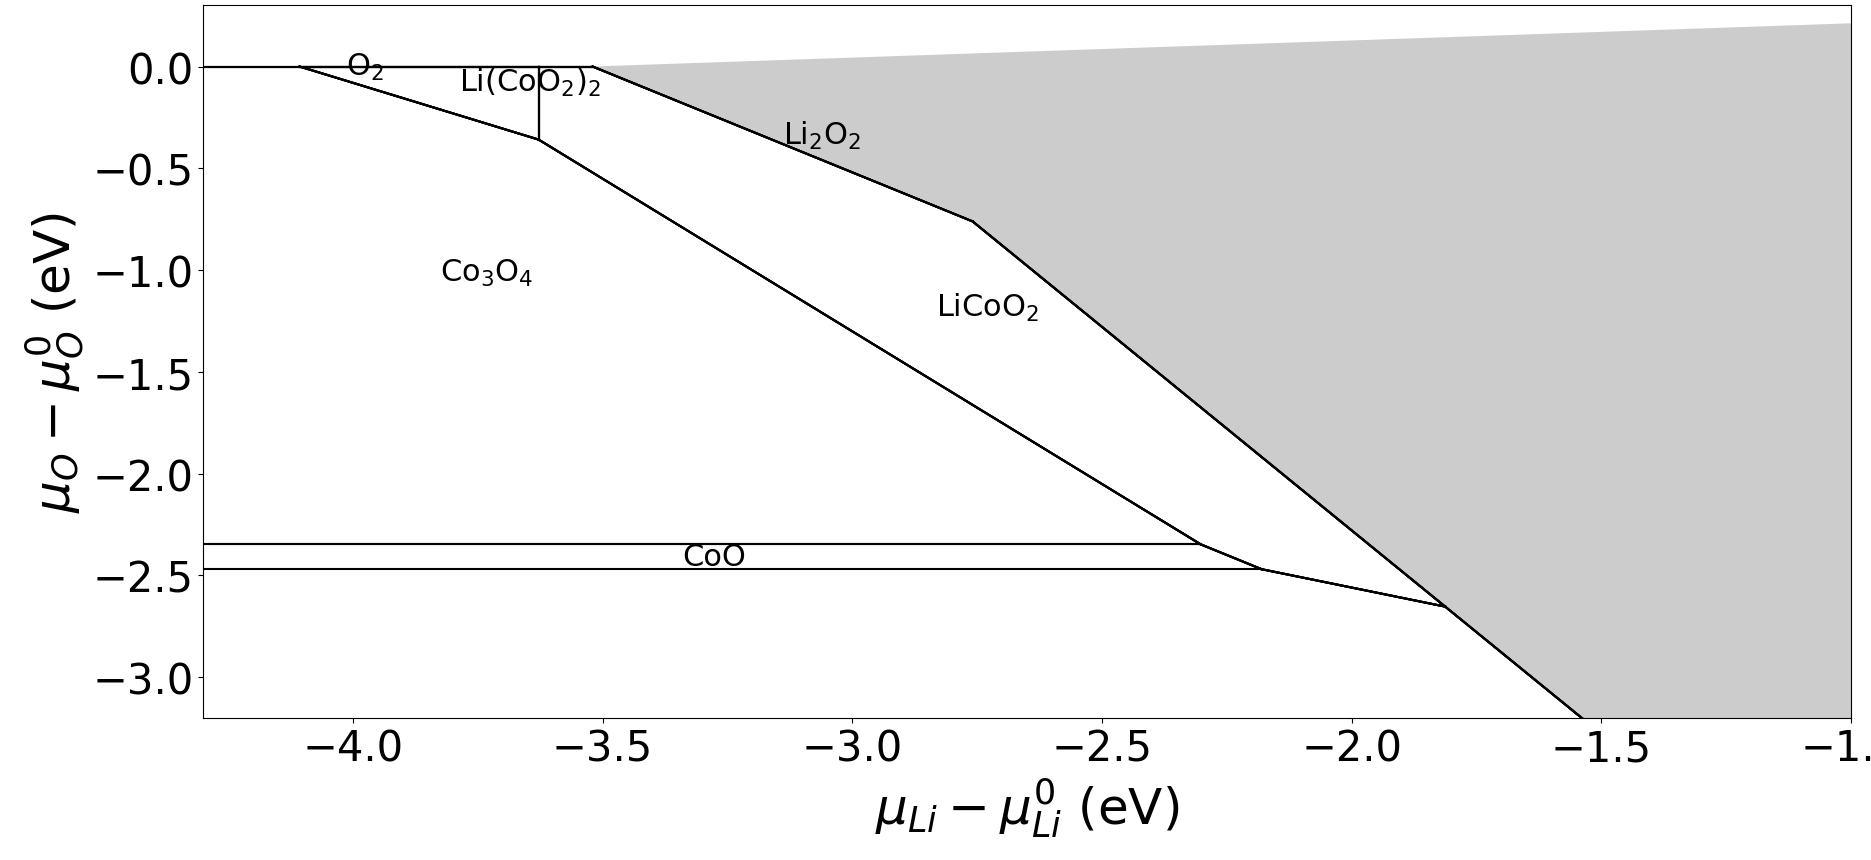
Chem pot space
Example for LiCoO2
from pymatgen.analysis.phase_diagram import PhaseDiagram, GrandPotentialPhaseDiagram, GrandPotPDEntry, PDPlotter, PDEntry
from pymatgen.core.periodic_table import Element
from pymatgen.core.composition import Composition

path = 'path_to_your_workdir/'


# Collect a dictionary of formation energies (from MP is ok) for interesting phases of considering system
# Note, pure components should have a zero
data_Li_Co_O = {
'Li'        : 0,
'O'         : 0,
'Co'        : 0,
'O2'        : 0,
'Co3O4'     : -1.394*7 , # mp-714961
'CoO2'      : -1.076*3 , # mp-1901
'CoO'       : -1.235*2 , # mp-715434
'LiCoO2'    : -1.780*4 , # mp-19149
'LiCo2O4'   : -1.516*7 , # mp-19149
'Li2O2'     : -1.760*4 , # mp-2340
'Li2O'      : -2.093*3 , # mp-2352
}

data = data_Li_Co_O
el = 'Li'
xlim = (-4.3, -1)
ylim = (-3.2, 0.3)
file = 'chemical_phase_Li_Co_O.png'


entries = []

for key in data:
    entries.append(PDEntry(Composition(key), data[key]))


PD = PhaseDiagram(entries, )


plot = PDPlotter(PD)

plt = plot.get_chempot_range_map_plot([Element(el), Element('O')])

plt.xlim(*xlim)
plt.ylim(*ylim)
plt.savefig(path+'/'+file,bbox_inches='tight')
plt.show()
Output:
tut/pd.txt · Last modified: 2023/04/03 16:16 by a.boev

